
Making reports configurable – how to work with „Page Parameters“.
Although the report pages can always be configured over the administration page, this can be really annoying, time consuming and needs admin rights for report pages. To fix this, you can simply implement configurable parameters in the report page, which will make the report more flexible.
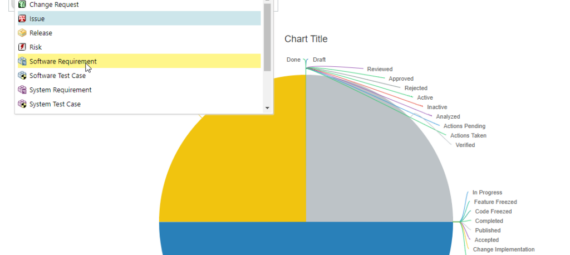
To show you how to do this, I will create a report page with a pie chart showing the different statuses of a selected work item type.
1. Define Page Parameter
To add such a selectable parameter, we have to go into the administration of the page and then to „Page Parameters“.
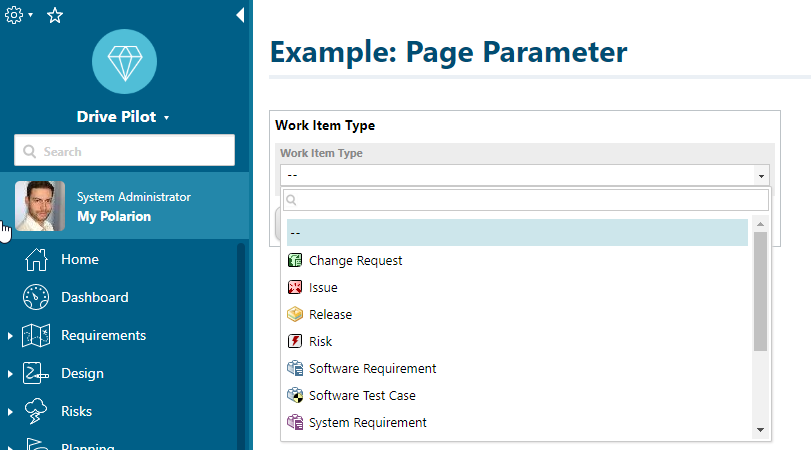
In this menu you can create a Page Parameter. They can be from different types. I will add an Enumeration (List) with all the existing work item types of the project.
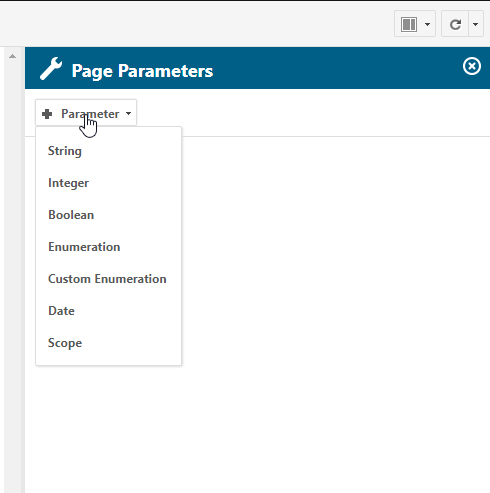
So I select „Enumeration“ and there we have to select a name and id for the parameter. Under the field „Enumeration“ we have access to all enumerations of the project. I select the enumeration „workitem-type“.
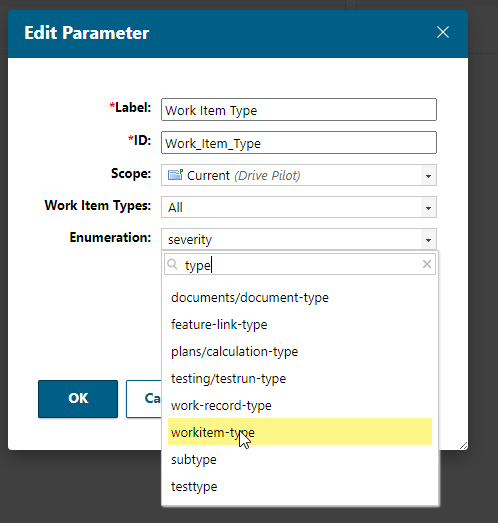
Click OK, if you are done with configuring the Page Parameter. It should now be shown in the Page Parameters panel. Here you can also set directly a default value, this will enable you to test the widget configuration during administration.
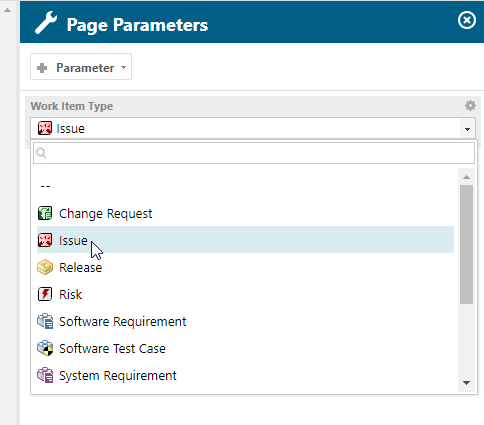
If I click „Appyl“, it will set the selected value as default value.
2. Insert Page Parameters Widget
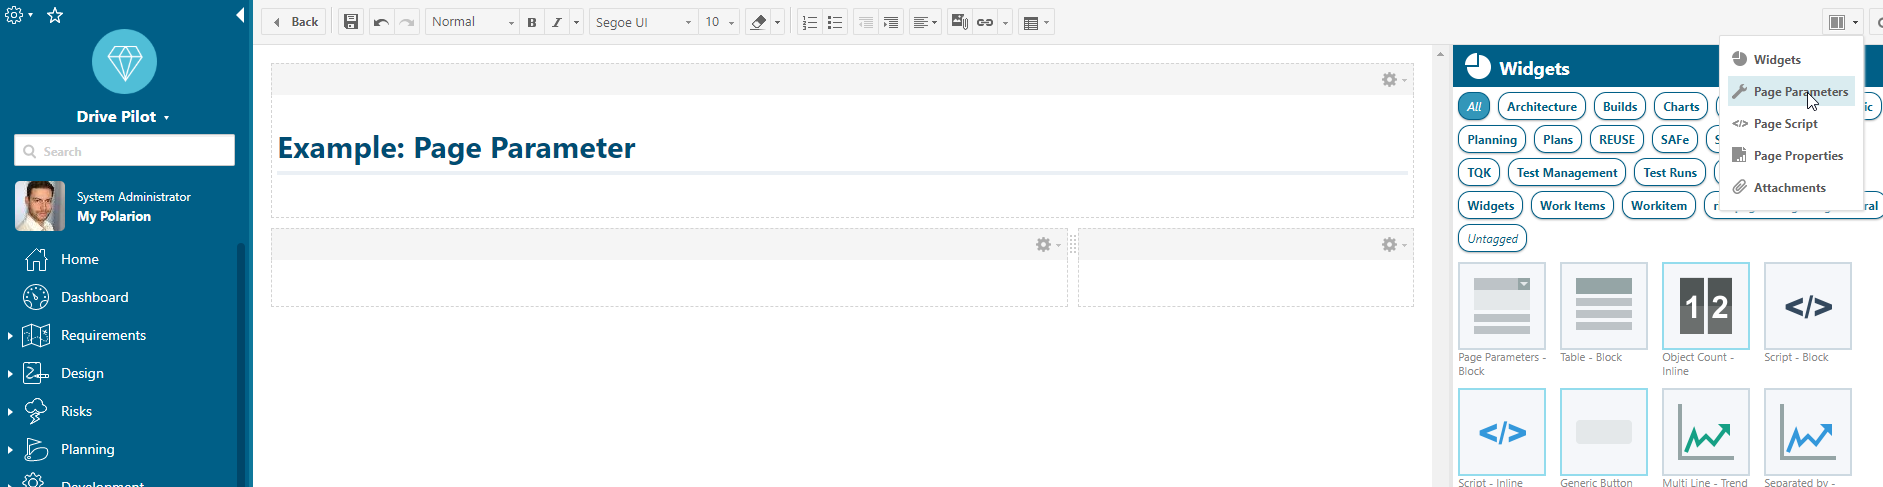
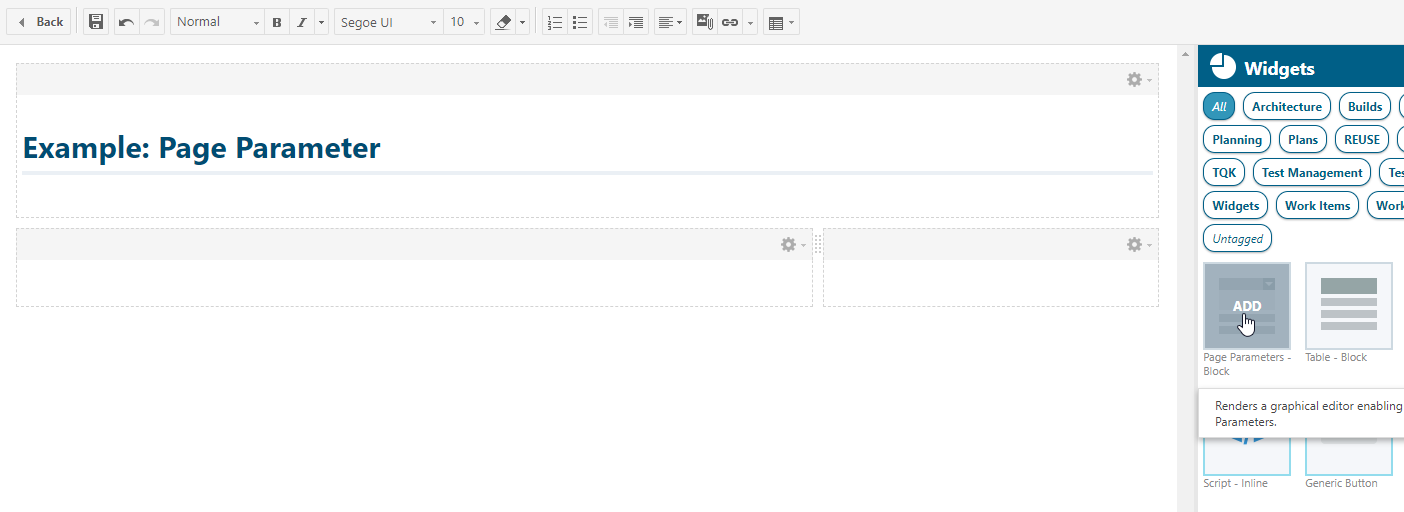
To make this Page Parameter available for users in the report page, I add the widget „Page Parameters“ to the report page.
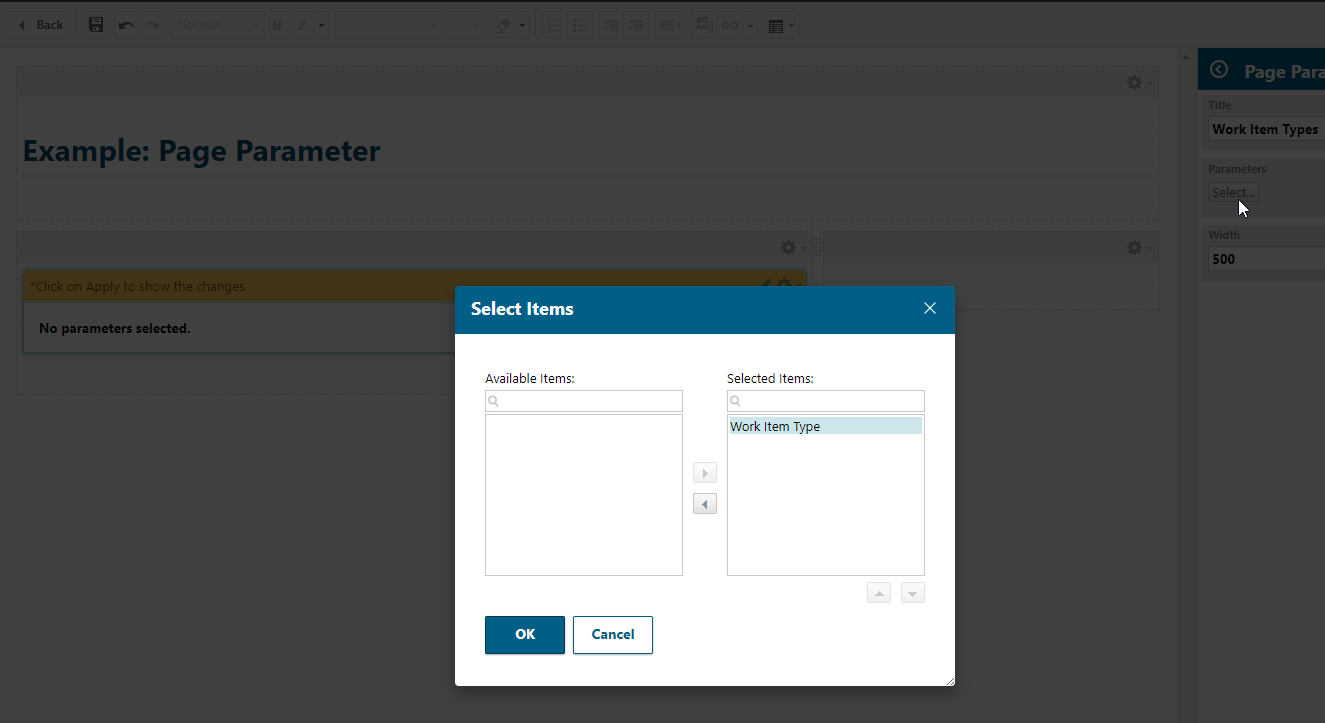
Now I have to configure this widget. Add a title and the Page Parameter, we’ve created before:
3. Add other Widgets and configure them using the Page Parameter
Now I will add a pie chart, showing the status of a selected work item type.
To enable the diagramm to show the selected work item type, I have to change the „Query Type“ from „Lucene“ to „Lucene + Velocity“.
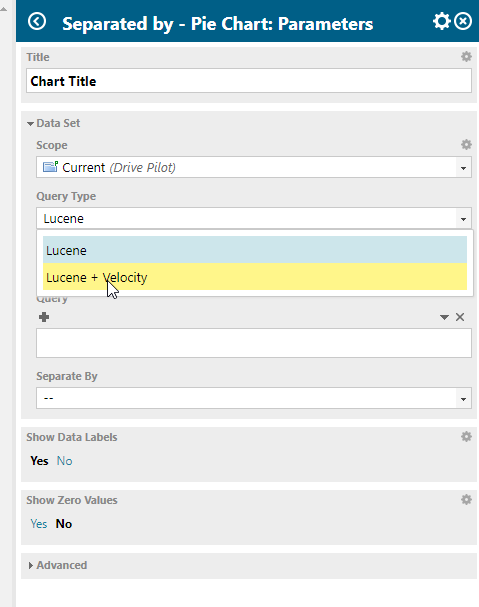
This change enables is, to add variables and logics into the „Query“-Area. It’s even possible to access the API via Velocity here and implement logic with this scripting language.
But in the end a valid Lucene string has to be „printed“ into the query area.
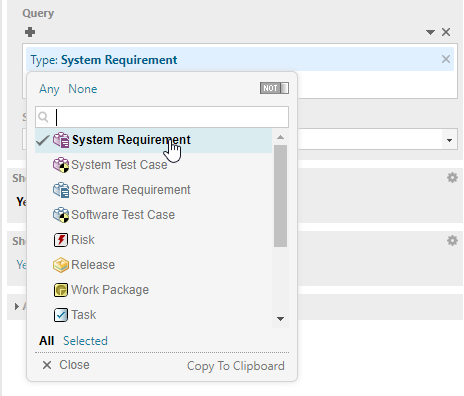
To show, how the query should look like, we can start by clicking one together via the query picker. So we have to click on the „+“ symbol below „Query“.
To see now the „true“ query, we have to convert the selected query to text. Therefore we have to click on the „down-arrow“ on the upper right and select „Convert to Text“.
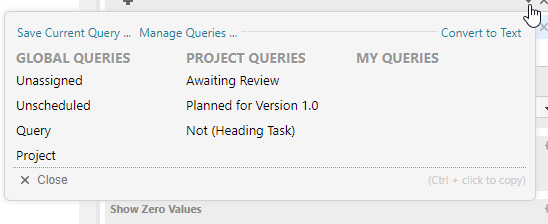
Now we know, how a correct query should look like:
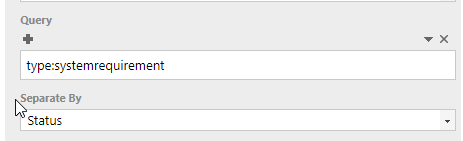
Now we selected all System Requirements. And if we add „Status“ to the field „Seperate By“, then the widget will show all System Requirements separated by their status.
But: We want to exchange the „systemrequirement“ with the Page Parameter variable, to make it dynamic for users.
So how do we get the variable? The variable is now available in the context of the report page. Depending on the kind of Page Parameter (String, Enumeration, Integer etc.), you have to access it differently. (Because you have to access lists in other ways than e.g. strings).
It’s described in detail in the widget SDK: in chapter 6.6 „How to use Page Parameters in Velocity and queries“ https://almdemo.polarion.com/polarion/sdk/doc/widget-sdk.pdf.
But most of the time it’s similar to this: „$pageParameters.[ID of Page Parameters].[value/values/singleValue]“.
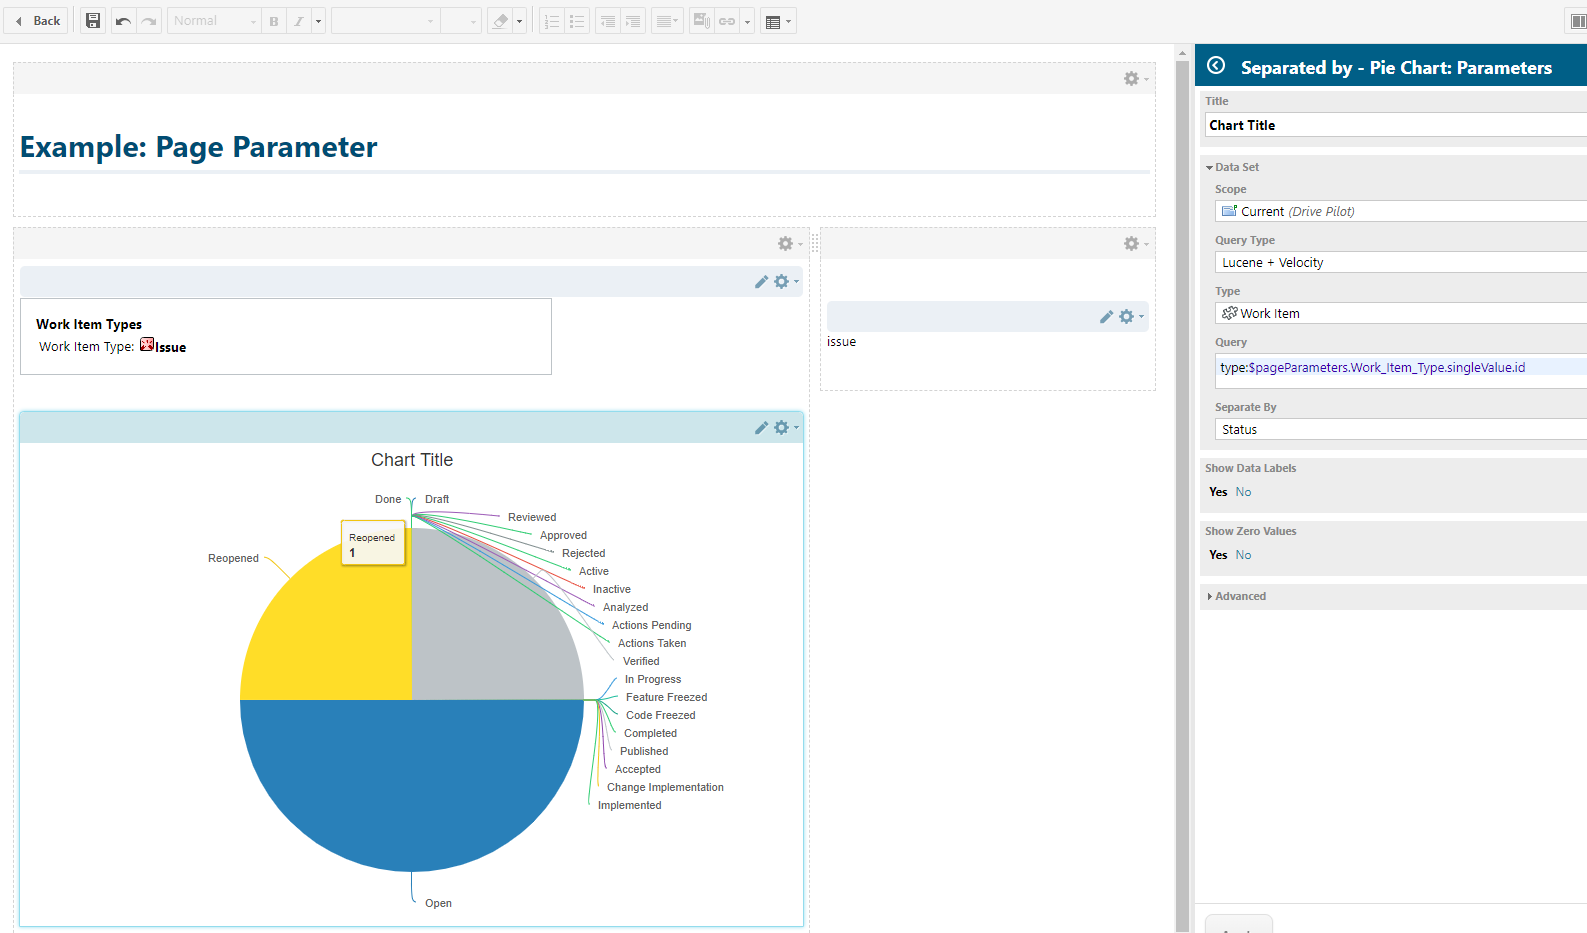
In our case (if the id of the Page Parameter is „Work_Item_Type“):
type:$pageParameters.Work_Item_Type.singleValue.idTip:
You might have noticed, that on the right side in my screenshots there is printed „issue“. I did this, by using the widget „Script Block“. There you can write Velocity code, to check out what your query really returns. (I do this for the creation of the query).
It’s simply the value, that will be printed, if I enter:
$pageParameters.Work_Item_Type.singleValue.idThis way I found out, that I have to add the „.id“ at the end. Because „.singleValue“ will just return the EnumerationOption object. This object has attributes like name, id, description, icon etc. .
To find this out you have to search the Polarion API. So check out the posts:
AND
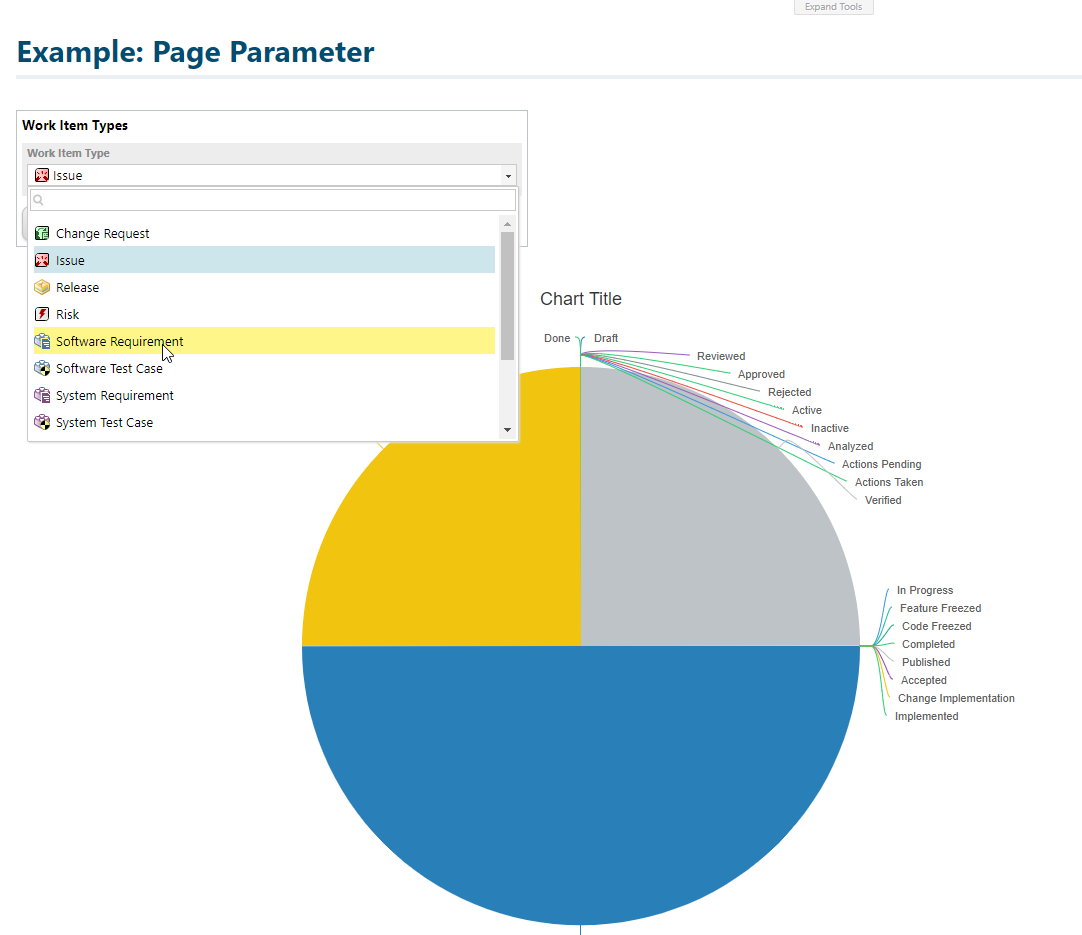
Voila – a configured report.
is there way to know how many users are viewing the page in wiki (similar to page counter feature). I think, post on end user analytics will be helpful
Hi Gowri,
thank you for the comment! I hope I understood you correctly: You want users to see which other users are viewing the page at the moment? Or is it more like a statistics thing over time?
Unfortunately I don’t have an existing solution for neither use case.
But there are three possible solutions that poped into my mind:
– The latest update of Polarion (21R1) brought this exact feature already for documents. (To see who else is working in the same document and it’s real time) – So maybe this would be able to be implemented the same way in Report Pages? But I have no clue how this would be done and if it is possible.
– The logs of Polarion contain the information who views which report page. But I’m not sure if you can find out, if somebody is still on the page. It’s more for analytics of administrators to check which projects and pages are used often and might be a place to improve productivity. (But it is definitely possible to write a script that checks for all calls of a report page and provides this data)
– There are websites available that allow you to be website-counters for you (you have to embedd a small js snippet). But of course nobody wants to embedd an external website to track your Polarion stats. But I guess the same technology could be used to set up an own page on the Apache that Polarion uses and tracks real-time the usage.
Unfortunately time is scarce at the moment and won’t be able to look deeper into it at the moment….
Kind regards,
PolarionDude
Looking for „is it more like a statistics thing over time?“ approach. could you please suggest „website-counters for you (you have to embed a small js snippet)“ standalone/open solutions. I am not considering just report page but all the classic wiki pages in polarion . Is there way to check in logs for all polarion classic wiki pages.
Thanks for quick reply. I am looking for „more like a statistics thing over time?“ .Could you please suggest few JS library/tools which can be used for this task. (This task is to know ,how many viewers are visiting the page over a period of time. which topic they are interested in, (all classic polarion wiki pages). Which logs needs this information is captured. any pointers to get the information from logs.
You can find the exact report page a user visited in the logs.
„2021-08-24 09:17:31,737 [ajp-nio-8889-exec-5 | u:admin | i:drivepilot/Requirements/Report e:polarion_client2] INFO TXLOGGER – Tx 5eddc15cf69d6_0_5eddc15cf69d6_0_: finished. Total: 0,511 s, CPU [user: 0,125 s, system: 0,0156 s]“
User Admin hat am 24.08.21 um 09:17:31 die Page drivepilot/Requirements/Report geöffnet.
–> Ein schlaues skript könnte das zu Statistiken auswerten.
Und mit webcounter z.B. https://www.hitwebcounter.com/.
Aber wie gesagt, nicht einfach so etwas externes angebunden, sondern das intern aufgesetzt.
Hi polarionDude, nice post.
I have a question: Is there a way to set the default value of a pageParameter in the page script?
In my use case the „Save as default“, in the page, is not available for „common“ users hence there is no way to remember the last input. Can a given input be assigned to the default value of that parameter using page script?
Thanks!
There is something called scripted page parameters. Those are page parameters set by a page script. I think in the SDK should be an example of it or atleast in some reports of the Drivepilot.
Best
PolarionDude